

Most data center teams treat cable routing as a final installation step. Something to figure out after the big systems are locked in. That approach fails in modern facilities. Rack densities have tripled. AI workloads demand fiber counts that seemed impossible a decade ago. BIM for Data Centers changes this dynamic by treating cable pathways as first-class systems from day one. Cable routing is often left to the engineers at the end and this can lead to costly rework. Those who plan it early finish faster and cheaper.
Cable Routing Is the Backbone of Data Center Infrastructure
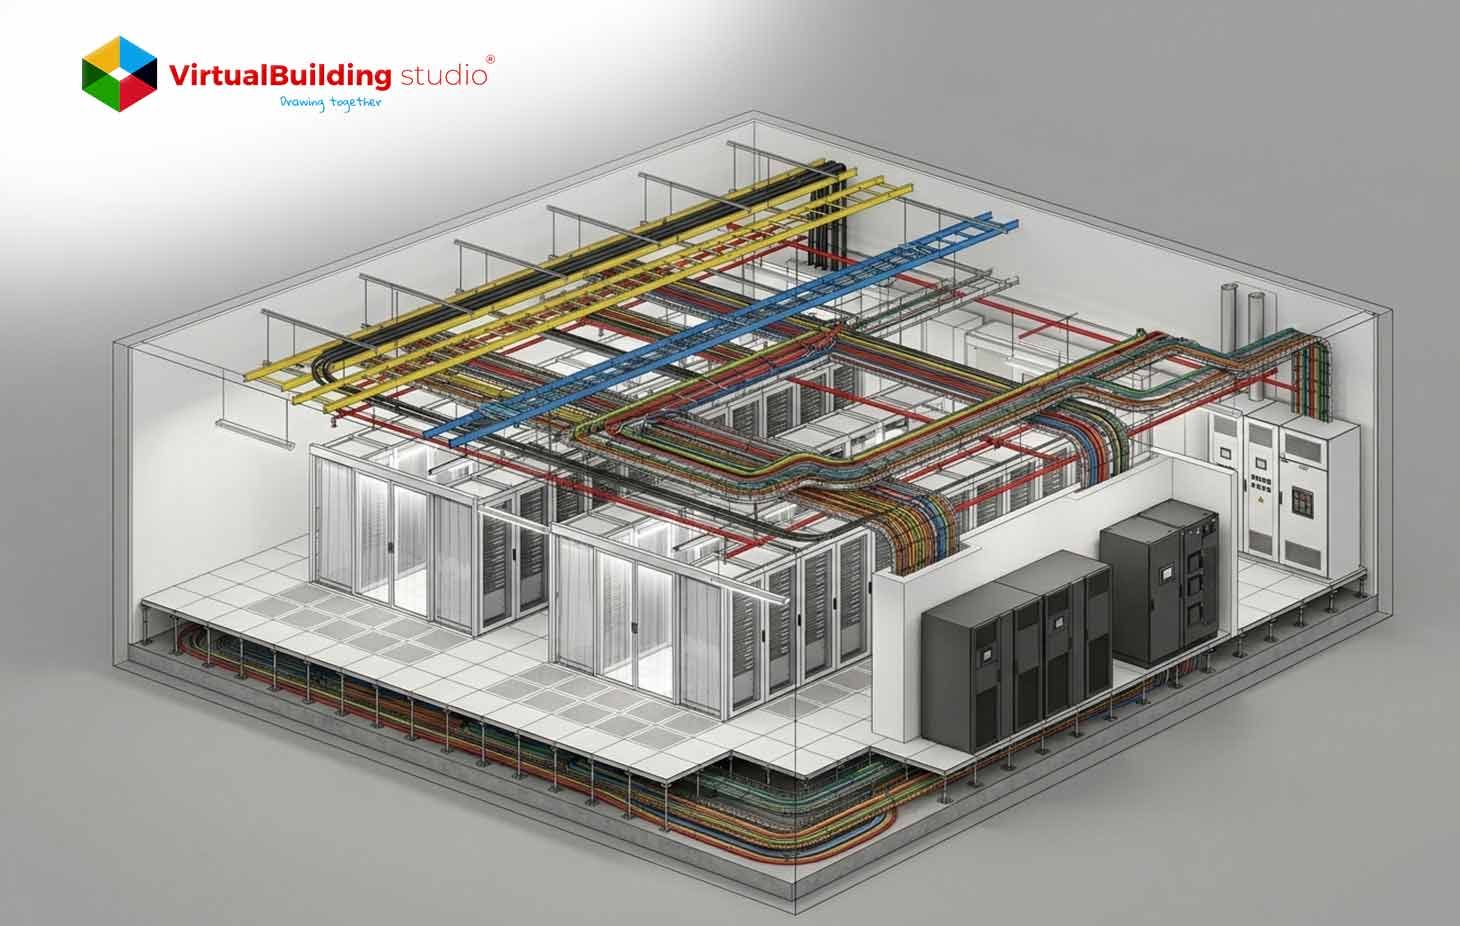
Cabling physically interconnects every active component in the facility. Servers, storage arrays, switches and upstream networks need structured pathways. ANSI/TIA-942 and BICSI 002, acknowledge cabling infrastructure as a critical design factor. They rightly require separation distances, redundancy requirements and capacity planning rules. Poorly structured cabling can cause performance problems. Congested bundles restrict airflow and generate thermal hot spots. Cooling systems work harder. Power usage effectiveness creeps upward. On the operations side, unmanaged cabling turns troubleshooting into a nightmare. Mean time to repair extends because technicians cannot trace circuits through the mess.
Many operators now treat structured cabling as a strategic asset. They embed pathway design into early coordination rather than leaving it to field improvisation. MEP BIM for Data Centers helps teams avoid these outcomes by integrating cable pathways into early coordination. The platform lets engineers visualize tray hierarchies before concrete is poured.
Why Cable Density Is Exploding in Mission Critical Data Centers
Three specific forces are driving cable volume upward. Each force affects tray design differently. Understanding them helps engineers plan capacity before congestion occurs. These forces are not slowing down. They are accelerating with each new hardware generation.
Higher rack densities
Legacy racks ran at 2-3 kW. Today, 10-20 kW is standard.AI platforms push 30-50 kW per rack. Some liquid-cooled configurations exceed 600 kW per rack. Each kilowatt requires power feeds and monitoring conductors. More power means more copper. More copper means larger cable bundles.
A single high-density rack can contain over 100 individual cables. That includes power whips, fiber uplinks, copper patch cords, and management lines. Multiply that by 50 racks in a row. You get thousands of cables competing for tray space. Data Center BIM Modeling lets teams calculate tray fill percentages before specifying hardware. They can see exactly where density will cause problems.
Cloud and AI workloads
Hyperscale cloud and AI training generate massive east-west traffic. Spine-leaf architectures rely on large fiber bundles between switches and server rows. AI pods cluster GPUs in dense zones. Those localized clusters create tray congestion hotspots.
Connecting a 10,000-GPU cluster can require 80,000 optical fibers. Standard fiber counts per rack have increased thirty times compared to traditional cloud racks. Engineers now use reduced-diameter fibers to pack more into existing conduits. But that demands precise routing to prevent signal loss. Data Center MEP Coordination detects these problem zones in the virtual model, enabling teams to alter tray layouts prior to construction.
Increased redundancy requirements
The TIA-942 and Uptime Institute Tier standards mandate redundant power and network paths. A and B feeds to racks. Diverse routing for critical circuits. Dual independent pathways effectively double your tray infrastructure.
| Tier | Architecture | Architecture | Availability |
|---|---|---|---|
| Rated-1: Basic | Single distribution path. No redundant components. | Single path. Vulnerable to planned and unplanned outages. | 99.6% |
| Rated-2: Redundant | Single distribution path with redundant components. | Single physical path. Redundant active nodes. | 99.7% |
| Rated-3: Concurrent | Multiple distribution paths. Concurrent maintenance allowed. | Dual, fully separated paths (A and B) in isolated zones. | 99.9% |
| Rated-4: Fault Tolerant | Multiple active-active paths. Survives worst-case physical failure. | Fully redundant, physically segregated, fire-isolated active-active paths. | 99.9% |
Rated-3 facilities require concurrently maintainable systems. Rated-4 requires fault tolerance with active-active paths. Each redundancy level adds more physical separation requirements. Path A and Path B cannot share the same tray or riser. They cannot pass through the same fire zone. Without explicit capacity planning, cable volume grows unpredictably. BIM Clash Detection Services detects spatial conflicts arising from double pathways at an early stage. Software like Navisworks Manage alerts any case where redundant paths contact the same support.
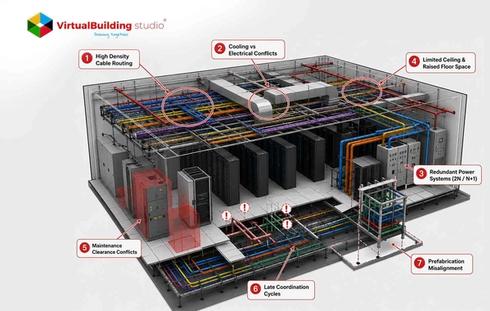
Key Challenges of Data Center Projects
The density explosion creates four recurring problems. Each problem has root causes in physical space, airflow, access or vertical transitions. Solving them requires coordinated effort across trades. These challenges compound when multiple generations of cabling accumulate over time.
Tray congestion
Cable volume approaches or exceeds recommended fill ratios.
BICSI limits cable depth to roughly 150 millimeters. The National Electrical Codecaps fill at 50 percent for ventilated trays. TIA recommends an even tighter 40 percent to leave room for future expansion.
Overfilled trays trap heat and add weight. They deform over time. The deformation creates pinch points that damage cable jackets. Many facilities accumulate abandoned cables under raised floors. Those dead bundles obstruct airflow and block maintenance access. Removing them requires downtime that operators cannot afford. MEP BIM Services include fill calculation based on actual cable diameters. Teams can model each cable type and its true cross-sectional area.
Interference with cooling airflow
Underfloor cabling creates blockages in plenum. Pressure distribution shifts. Cold air volume through perforated tiles drops. Some tiles receive too much air. Others receive almost none. Servers at the end of rows overheat. Hot and cold streams come together.
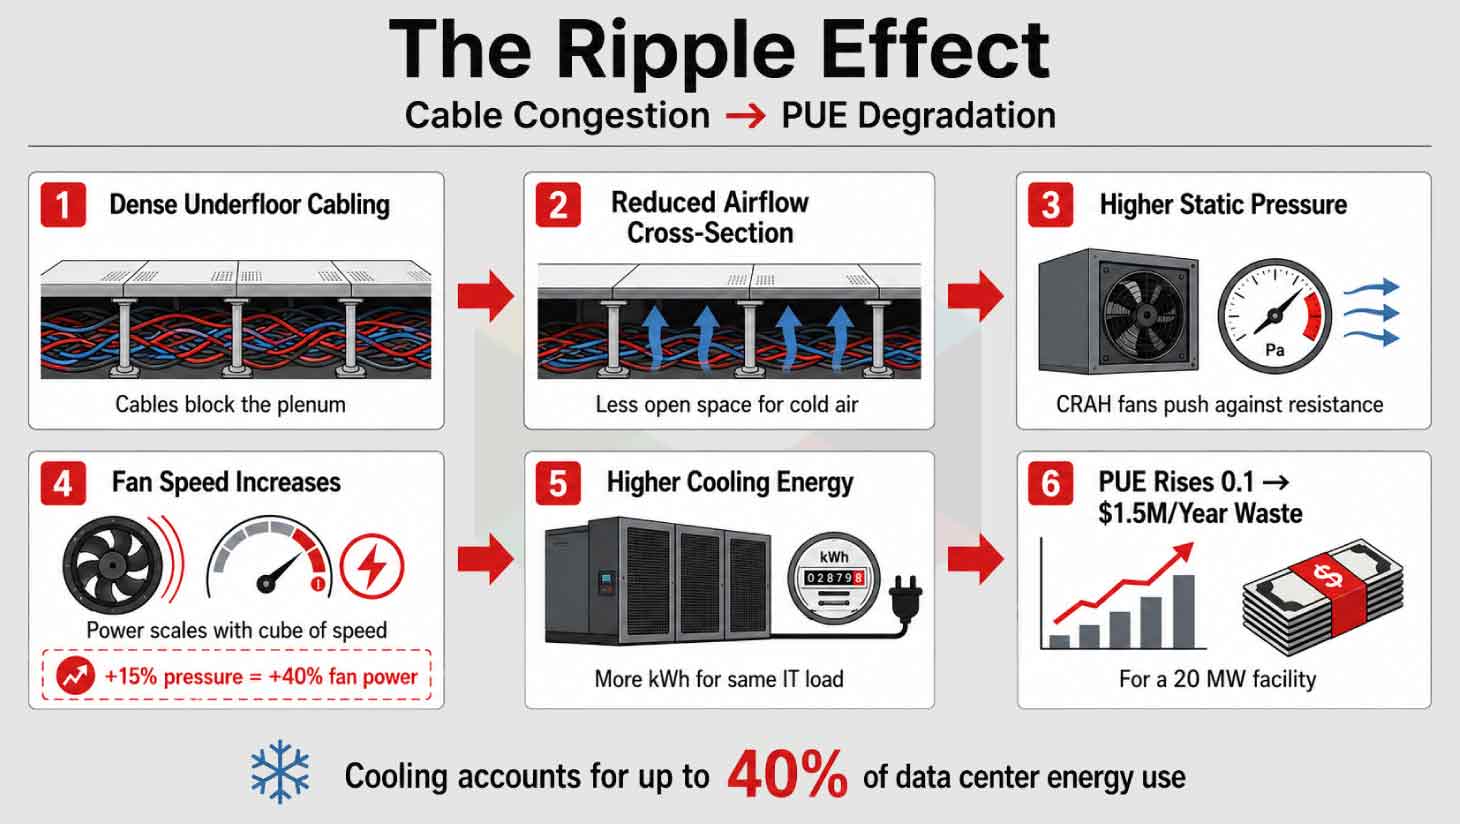
Overhead bundles block hot air return paths. Cooling effectiveness is reduced. To compensate, fan speeds are increased. Energy use is increased. A 15% blockage can increase fan power by more than 40% due to cubic scaling laws. BIM Coordination Services help teams route trays away from critical airflow zones. The software models pressure drops before construction begins.
Maintenance accessibility
Overfilled trays and unstructured bundles obscure labeling. They block panel doors and egress routes. When incidents occur technicians can’t trace circuits quick enough. Mean time to repair extends. Planned maintenance windows grow longer.
Simple moves, adds, and changes become risky operations. A technician reaching into a congested tray might accidentally disconnect a live circuit. That causes an outage. The Uptime Institute has documented that poor cable management directly contributes to nearly half of all troubleshooting delays in active data centers. BIM documentation for data centers captures cable IDs and tray tags for future reference. Operators can plan interventions virtually before touching any hardware.
Routing across multiple levels
Power and data must transition between main distribution rooms and white space. Risers, mezzanines and catwalks add complicated geometry. Every level change requires custom fittings. Each bend must respect the cable minimum bend radius.
Without coordinated 3D modeling, stacked pathways clash with beams and ductwork. Field rerouting increases tray lengths and bends. Longer trays cost more. More bends increase signal attenuation. Structural engineers must verify hanger loads at every transition point. A fully loaded 24-inch tray can weigh hundreds of pounds per linear foot. Data Center BIM Services visualize these multi-level routes before installation. Teams can prefabricate complex fittings off-site.
Impact of High-Density Cable Routing on Data Center Design
When cable density grows without coordination, three design consequences follow. Each consequence forces trade-offs between routing, space, and thermal performance. These trade-offs affect architectural decisions, mechanical layouts, and structural loading.
Reduced ceiling and plenum space
HVAC ducts, fire suppression mains, lighting, and cable trays compete for overhead clearance. Multiple redundant pathways consume significant vertical space. Oversized trays intrude into plenum zones. They encroach on ductwork clearances.
Modern slab-on-grade designs use the overhead ceiling as a hot air return plenum. That plenum must remain mostly open. Cable trays block the return path. Engineers then need deeper structural bays or taller buildings. Both options add cost. Meeting installation standards becomes harder with every added cable. MEP BIM coordination workflow establishes priority rules for ceiling space allocation. HVAC gets priority, then fire suppression and then cable trays. The model enforces these rules automatically.
Increased clashes with HVAC and piping
Cable trays follow long orthogonal runs. Those runs intersect mechanical routes at many points. Common clashes include trays crossing supply ducts and conflicting with chilled water piping. HVAC and large pipes have less routing flexibility than cable trays.
Industry practice gives them priority. Trays get pushed lower or offset. But offsets create new problems. They increase tray length. They add fittings. They consume more vertical space. A single offset can cascade into multiple redesigns. BIM Clash Detection Services surface these conflicts before the field discovers them. Teams can resolve ten clashes in a one-hour coordination meeting instead of ten field change orders.
Thermal inefficiencies
Underfloor cable congestion causes reverse vortices and pressure anomalies. Cold air recirculates or bypasses intended tile locations. Unsealed penetrations leak cold air into hot aisles. Containment strategies fail.
Overhead bundles trap heat around cable jackets. Copper cables carrying power over Ethernet can exceed 60 degrees Celsius in dense bundles. That heat degrades signal quality. It can melt insulation over time. Elevated tray temperatures force current-carrying derating. A cable rated for 20 amps might only handle 15 amps in a congested tray. MEP BIM for Data Centers connects tray geometry with thermal analysis to improve decision-making. Engineers can run heat-up simulations before defining cable types.
BIM Solutions for Data Center
These design impacts have direct solutions in the virtual environment. Each solution targets a specific failure mode. Together they form a complete coordination workflow. The key is applying these solutions before any physical installation begins.
3D tray routing visualization
Data Center BIM Modeling provides detailed 3D trays with elevations and bend geometries. Teams run through scenarios and modify layouts to minimize length. Visualization uncovers clashes that 2D drawings conceal. MEP BIM Modeling Services produce LOD 400 models for fabrication. Every hanger and fitting gets modeled. Shops prefabricate assemblies from the model.
Clash detection across trades
BIM Clash Detection Services use Navisworks to find geometric conflicts automatically. Ducts versus trays. Pipes versus ladders. Iterative detection eliminates on-site clashes. Resolving conflicts in the model costs pennies. Resolving them in the field costs thousands. BIM for Data Centers lets teams track clash status weekly.
Airflow-aware routing coordination
MEP BIM for Data Centers links with Computational Fluid Dynamics analysis. Engineers study the effect of cable blocks on temperature distribution. Test alternative tray locations. A CFD simulation might show that moving a tray six inches improves airflow by 15 percent. That change costs nothing in the model. Data Center MEP Coordination integrates these simulations into weekly reviews.
Clearance validation
BIM Coordination Services enforce clearance rules for electrical panels and egress routes. The National Electrical Code requires 36 inches of panel clearance. Inspectors fail projects where trays block access. Fixing it in the model is free.
MEP BIM Services configure these rules before modeling begins. The software flags violations automatically.
Best Practices for Designing High-Density Cable Routing
Industry standards and field experience point to three core practices. Implement them inside your BIM environment for best results.
Define routing hierarchy
Primary trays carry large bundles along main corridors. Secondary trays branch off to server rows. Encode this hierarchy using tray types and colors. Data Center BIM Services can help in defining routing hierarchy through parametric families with priority metadata.
Separate power and data pathways
TIA-942 requires physical separation to minimize interference. Designers model separate trays for power and data. They use different elevations or lateral offsets. Cross at 90 degree angles when necessary. Record this logic for technicians in BIM documentation for Data Center projects.
Coordinate with cooling systems early
Early ASHRAE guidelines highlight removing abandoned cabling and closing penetrations. Bring tray layouts into your MEP BIM coordination workflow before mechanical design finishes. Evaluate tray impact on underfloor pressure. A tray above a perforated tile blocks cold air. Move it six inches sideways and airflow improves.
MEP BIM Modeling Services let engineers test multiple layouts in one morning.
Advanced Insight on BIM for Data Centers
Beyond clash avoidance, BIM enables operational efficiency analysis. The connection between cable routing and energy consumption is measurable. Not doing anything about it costs you money every month.
Bad cable management can hurt the cooling efficiency and increase energy costs.
Cable blockages under the floor reduce the cross-section of the airflow. Tile flows become uneven. Hot spots develop. The cooling system works harder.
Fan speeds increase to keep climate within safe limits. Fan power scales with the cube of fan speed. Those fans run 24/7. The extra cost adds up fast.
Cooling accounts for up to 40 percent of data center energy use. Poor cable management drives that number higher. BIM for Data Centers lets designers evaluate routing against energy consumption. Data Center BIM Services optimize both geometry and long-term PUE.
Cable blockages can push PUE from 1.2 to 1.3. On a 20-megawatt facility, that 0.1 difference wastes 2 megawatts. At average rates, that exceeds $1.5 million per year. The BIM model costs far less.
Conclusion
High-density cable routing has become a central design concern for mission-critical data centers. Rack densities keep climbing. AI workloads multiply fiber counts. Redundancy requirements double the physical footprint of pathways. Unmanaged cable volume leads to tray congestion, airflow obstruction, and maintenance difficulties.
BIM for Data Centers provides a pragmatic solution to these issues. MEP BIM Services provide 3D tray visualization and cross-trade clash detection. BIM Clash Detection Services aid in early conflict identification. BIM Coordination Services verify that clearance rules and priority hierarchies are respected. MEP BIM for Data Centers connects geometry and thermal simulation. Data Center MEP Coordination brings mechanical and electrical teams together.
Teams can design data centers that support high density without sacrificing efficiency by using routing hierarchies, segregated power and data paths along with early coordination with cooling systems. This is possible through Data Center BIM Modeling. BIM documentation for data centers keeps the logic intact for future operators.
Data Center BIM Services are essential for owners and operators. Cable growth compounds over the facility's lifecycle. Well-designed cable routing becomes a strategic enabler of reliability and energy efficiency. The alternative is no longer acceptable. Poor routing costs money every day. Good routing saves money from day one.


.jpg)